Consider this random experiment. You ask people (one at a time) of their birthdays (month and day only). The process continues until there is a repeat in the series of birthdays, in other words, until two people you’ve surveyed share the same birthday. How many people you have to ask before finding a repeat? What is the probability that you will have to ask 
In the problem at hand, we ignore leap year and assume that each of the 365 days in the year is equally likely to be the birthday for a randomly chosen person. The birthday problem is typically the following question. How many people do we need to choose in order to have a 50% or better chance of having a common birthday among the selected individuals?
The random experiment stated at the beginning can be restated as follows. Suppose that balls are randomly thrown (one at a time) into 


___________________________________________________________________________
The Birthday Problem
First, we start with the birthday problem. The key is to derive the probability that in a group of 
![\displaystyle \begin{aligned} p_k&=\frac{365}{365} \ \frac{364}{365} \ \frac{363}{365} \cdots \frac{365-(k-1)}{365} \\&=\frac{364}{365} \ \frac{363}{365} \cdots \frac{365-(k-1)}{365} \\&=\biggl[1-\frac{1}{365} \biggr] \ \biggl[1-\frac{2}{365} \biggr] \cdots \biggl[1-\frac{k-1}{365} \biggr] \ \ \ \ \ \ \ \ \ \ \ \ \ \ \ \ \ \ \ \ \ \ \ \ \ \ \ \ \ (1) \end{aligned}](http://s0.wp.com/latex.php?latex=%5Cdisplaystyle+%5Cbegin%7Baligned%7D+p_k%26%3D%5Cfrac%7B365%7D%7B365%7D+%5C+%5Cfrac%7B364%7D%7B365%7D+%5C+%5Cfrac%7B363%7D%7B365%7D+%5Ccdots+%5Cfrac%7B365-%28k-1%29%7D%7B365%7D+%5C%5C%26%3D%5Cfrac%7B364%7D%7B365%7D+%5C+%5Cfrac%7B363%7D%7B365%7D+%5Ccdots+%5Cfrac%7B365-%28k-1%29%7D%7B365%7D+%5C%5C%26%3D%5Cbiggl%5B1-%5Cfrac%7B1%7D%7B365%7D+%5Cbiggr%5D+%5C+%5Cbiggl%5B1-%5Cfrac%7B2%7D%7B365%7D+%5Cbiggr%5D+%5Ccdots+%5Cbiggl%5B1-%5Cfrac%7Bk-1%7D%7B365%7D+%5Cbiggr%5D+%5C+%5C+%5C+%5C+%5C+%5C+%5C+%5C+%5C+%5C+%5C+%5C+%5C+%5C+%5C+%5C+%5C+%5C+%5C+%5C+%5C+%5C+%5C+%5C+%5C+%5C+%5C+%5C+%5C+%281%29+%5Cend%7Baligned%7D&bg=ffffff&fg=333333&s=0&c=20201002)
where 

To answer the birthday problem, just plug in values of 


In a random group of 23 people, there is a less than 50% chance of having distinct birthdays, and thus a more than 50% chance of having at least one identical birthday. This may be a surprising result. Without the benefit of formula (1), some people may think that it will take a larger sample to obtain a repeat.
The benefit of (1) extends beyond the birthday problem. Let’s consider the case for 

![\displaystyle \begin{aligned} p_{n,k}&=\frac{n}{n} \ \frac{n-1}{n} \ \frac{n-2}{n} \cdots \frac{n-(k-1)}{n} \\&=\frac{n-1}{n} \ \frac{n-2}{n} \cdots \frac{n-(k-1)}{n} \\&=\biggl[1-\frac{1}{n} \biggr] \ \biggl[1-\frac{2}{n} \biggr] \cdots \biggl[1-\frac{k-1}{n} \biggr] \ \ \ \ \ \ \ \ \ \ \ \ \ \ \ \ \ \ \ \ \ \ \ \ \ \ \ \ \ (2) \end{aligned}](http://s0.wp.com/latex.php?latex=%5Cdisplaystyle+%5Cbegin%7Baligned%7D+p_%7Bn%2Ck%7D%26%3D%5Cfrac%7Bn%7D%7Bn%7D+%5C+%5Cfrac%7Bn-1%7D%7Bn%7D+%5C+%5Cfrac%7Bn-2%7D%7Bn%7D+%5Ccdots+%5Cfrac%7Bn-%28k-1%29%7D%7Bn%7D+%5C%5C%26%3D%5Cfrac%7Bn-1%7D%7Bn%7D+%5C+%5Cfrac%7Bn-2%7D%7Bn%7D+%5Ccdots+%5Cfrac%7Bn-%28k-1%29%7D%7Bn%7D+%5C%5C%26%3D%5Cbiggl%5B1-%5Cfrac%7B1%7D%7Bn%7D+%5Cbiggr%5D+%5C+%5Cbiggl%5B1-%5Cfrac%7B2%7D%7Bn%7D+%5Cbiggr%5D+%5Ccdots+%5Cbiggl%5B1-%5Cfrac%7Bk-1%7D%7Bn%7D+%5Cbiggr%5D+%5C+%5C+%5C+%5C+%5C+%5C+%5C+%5C+%5C+%5C+%5C+%5C+%5C+%5C+%5C+%5C+%5C+%5C+%5C+%5C+%5C+%5C+%5C+%5C+%5C+%5C+%5C+%5C+%5C+%282%29+%5Cend%7Baligned%7D&bg=ffffff&fg=333333&s=0&c=20201002)
Formula (2) will be useful in the next section.
___________________________________________________________________________
The Random Variable
We now look into the random variable discussed at the beginning, either the one for picking people at random until a repeated birthday or throwing balls into cells until one cell has two balls. To illustrate the idea, let’s look at an example.
Example 1
Roll a fair die until obtaining a repeated face value. Let 
![P[X_6=k]](http://s0.wp.com/latex.php?latex=P%5BX_6%3Dk%5D&bg=ffffff&fg=333333&s=0&c=20201002)

Note that

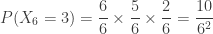


To get a repeat in 2 rolls, there are 6 choices for the first roll and the second has only one choice – the value of the first roll. To get a repeat in 3 rolls, there are 6 choices for the first roll, 5 choices for the second roll and the third roll must be out of the 2 previous two distinct values. The idea is that the first 

The reasoning process leads nicely to the general case. In the general case, let’s consider the occupancy interpretation. In throwing balls into ![P[X_n=k]](http://s0.wp.com/latex.php?latex=P%5BX_n%3Dk%5D&bg=ffffff&fg=333333&s=0&c=20201002)
![\displaystyle \begin{aligned} P[X_n=k]&=\frac{n}{n} \times \frac{n-1}{n} \times \cdots \times \frac{n-(k-2)}{n} \times \frac{k-1}{n} \\&=\frac{n-1}{n} \times \cdots \times \frac{n-(k-2)}{n} \times \frac{k-1}{n} \\&=\frac{(n-1) \times (n-2) \times \cdots \times (n-(k-2)) \times (k-1)}{n^{k-1}} \\&=\biggl[1-\frac{1}{n} \biggr] \times \biggl[1-\frac{2}{n} \biggr] \times \cdots \times \biggl[1-\frac{k-2}{n}\biggr] \times \frac{k-1}{n} \ \ \ \ \ \ \ (3) \end{aligned}](http://s0.wp.com/latex.php?latex=%5Cdisplaystyle+%5Cbegin%7Baligned%7D+P%5BX_n%3Dk%5D%26%3D%5Cfrac%7Bn%7D%7Bn%7D+%5Ctimes+%5Cfrac%7Bn-1%7D%7Bn%7D+%5Ctimes+%5Ccdots+%5Ctimes+%5Cfrac%7Bn-%28k-2%29%7D%7Bn%7D+%5Ctimes+%5Cfrac%7Bk-1%7D%7Bn%7D+%5C%5C%26%3D%5Cfrac%7Bn-1%7D%7Bn%7D+%5Ctimes+%5Ccdots+%5Ctimes+%5Cfrac%7Bn-%28k-2%29%7D%7Bn%7D+%5Ctimes+%5Cfrac%7Bk-1%7D%7Bn%7D+%5C%5C%26%3D%5Cfrac%7B%28n-1%29+%5Ctimes+%28n-2%29+%5Ctimes+%5Ccdots+%5Ctimes+%28n-%28k-2%29%29+%5Ctimes+%28k-1%29%7D%7Bn%5E%7Bk-1%7D%7D+%5C%5C%26%3D%5Cbiggl%5B1-%5Cfrac%7B1%7D%7Bn%7D+%5Cbiggr%5D+%5Ctimes+%5Cbiggl%5B1-%5Cfrac%7B2%7D%7Bn%7D+%5Cbiggr%5D+%5Ctimes+%5Ccdots+%5Ctimes+%5Cbiggl%5B1-%5Cfrac%7Bk-2%7D%7Bn%7D%5Cbiggr%5D+%5Ctimes+%5Cfrac%7Bk-1%7D%7Bn%7D++%5C+%5C+%5C+%5C+%5C+%5C+%5C+%283%29+%5Cend%7Baligned%7D&bg=ffffff&fg=333333&s=0&c=20201002)
where 
The reasoning is similar to Example 1. To get a repeat in throwing 
Once the probability function (3) is obtained, the mean ![E[X_n]](http://s0.wp.com/latex.php?latex=E%5BX_n%5D&bg=ffffff&fg=333333&s=0&c=20201002)
![E[X_{365}]=24.62](http://s0.wp.com/latex.php?latex=E%5BX_%7B365%7D%5D%3D24.62&bg=ffffff&fg=333333&s=0&c=20201002)
Another interesting quantity is ![P[X_n>k]](http://s0.wp.com/latex.php?latex=P%5BX_n%3Ek%5D&bg=ffffff&fg=333333&s=0&c=20201002)
![P[X_n \le k]](http://s0.wp.com/latex.php?latex=P%5BX_n+%5Cle+k%5D&bg=ffffff&fg=333333&s=0&c=20201002)

![\displaystyle P[X_n>k]=\biggl[1-\frac{1}{n} \biggr] \ \biggl[1-\frac{2}{n} \biggr] \cdots \biggl[1-\frac{k-1}{n} \biggr] \ \ \ \ \ \ \ \ \ \ \ \ \ \ \ \ \ \ \ \ \ \ \ \ (4)](http://s0.wp.com/latex.php?latex=%5Cdisplaystyle+P%5BX_n%3Ek%5D%3D%5Cbiggl%5B1-%5Cfrac%7B1%7D%7Bn%7D+%5Cbiggr%5D+%5C+%5Cbiggl%5B1-%5Cfrac%7B2%7D%7Bn%7D+%5Cbiggr%5D+%5Ccdots+%5Cbiggl%5B1-%5Cfrac%7Bk-1%7D%7Bn%7D+%5Cbiggr%5D+%5C+%5C+%5C+%5C+%5C+%5C+%5C+%5C+%5C+%5C+%5C+%5C+%5C+%5C+%5C+%5C+%5C+%5C+%5C+%5C+%5C+%5C+%5C+%5C+%284%29&bg=ffffff&fg=333333&s=0&c=20201002)
___________________________________________________________________________
Back to The Birthday Problem
Consider the case for 
![P[X_{365} \le k]](http://s0.wp.com/latex.php?latex=P%5BX_%7B365%7D+%5Cle+k%5D&bg=ffffff&fg=333333&s=0&c=20201002)
![P[X_{365}>k]](http://s0.wp.com/latex.php?latex=P%5BX_%7B365%7D%3Ek%5D&bg=ffffff&fg=333333&s=0&c=20201002)


The birthday problem is equivalently about finding the median of the random variable 
![\begin{array}{ccccccc} k & \text{ } & P[X_{365}>k] & \text{ } & P[X_{365} \le k] & \text{ } & \text{Percentile} \\ \text{ } & \text{ } & \text{ } & \text{ } & \text{ } & \\ 14 & \text{ } & 0.77690 & & 0.22310 & \\ 15 & \text{ } & 0.74710 & & 0.25290 & \text{ } & \text{25th Percentile} \\ 16 & \text{ } & 0.71640 & & 0.28360 & \\ \text{ } & \text{ } & \text{ } & \text{ } & \text{ } & \\ 22 & \text{ } & 0.52430 & & 0.47570 & \\ 23 & \text{ } & 0.49270 & & 0.50730 & \text{ } & \text{50th Percentile} \\ 24 & \text{ } & 0.46166 & & 0.53834 & \\ \text{ } & \text{ } & \text{ } & \text{ } & \text{ } & \\ 31 & \text{ } & 0.26955 & & 0.73045 & \\ 32 & \text{ } & 0.24665 & & 0.75335 & \text{ } & \text{75th Percentile} \\ 33 & \text{ } & 0.22503 & & 0.77497 & \\ \text{ } & \text{ } & \text{ } & \text{ } & \text{ } & \\ 40 & \text{ } & 0.10877 & & 0.89123 & \\ 41 & \text{ } & 0.09685 & & 0.90315 & \text{ } & \text{90th Percentile} \\ 42 & \text{ } & 0.08597 & & 0.91403 & \\ \text{ } & \text{ } & \text{ } & \text{ } & \text{ } & \\ 46 & \text{ } & 0.05175 & & 0.94825 & \\ 47 & \text{ } & 0.04523 & & 0.95477 & \text{ } & \text{95th Percentile} \\ 48 & \text{ } & 0.03940 & & 0.96060 & \\ \text{ } & \text{ } & \text{ } & \text{ } & \text{ } & \\ 56 & \text{ } & 0.01167 & & 0.98833 & \\ 57 & \text{ } & 0.00988 & & 0.99012 & \text{ } & \text{99th Percentile} \\ 58 & \text{ } & 0.00834 & & 0.99166 & \\ \end{array}](http://s0.wp.com/latex.php?latex=%5Cbegin%7Barray%7D%7Bccccccc%7D++++k+%26++%5Ctext%7B+%7D+%26+P%5BX_%7B365%7D%3Ek%5D++%26+%5Ctext%7B+%7D+%26+P%5BX_%7B365%7D+%5Cle+k%5D+%26+%5Ctext%7B+%7D+%26+%5Ctext%7BPercentile%7D+%5C%5C++++%5Ctext%7B+%7D+%26+++%5Ctext%7B+%7D+%26+%5Ctext%7B+%7D+%26+%5Ctext%7B+%7D+%26+%5Ctext%7B+%7D+%26++%5C%5C+++14+%26+++%5Ctext%7B+%7D+%26+0.77690+%26++%26+0.22310+%26++%5C%5C+++15+%26+++%5Ctext%7B+%7D+%26+0.74710+%26++%26+0.25290+%26+%5Ctext%7B+%7D+%26+%5Ctext%7B25th+Percentile%7D+%5C%5C+++16+%26+++%5Ctext%7B+%7D+%26+0.71640+%26++%26+0.28360+%26++%5C%5C++%5Ctext%7B+%7D+%26+++%5Ctext%7B+%7D+%26+%5Ctext%7B+%7D+%26+%5Ctext%7B+%7D+%26+%5Ctext%7B+%7D+%26++%5C%5C+++22+%26+++%5Ctext%7B+%7D+%26+0.52430+%26++%26+0.47570+%26++%5C%5C+++23+%26+++%5Ctext%7B+%7D+%26+0.49270+%26++%26+0.50730+%26+%5Ctext%7B+%7D+%26+%5Ctext%7B50th+Percentile%7D++%5C%5C+++24+%26+++%5Ctext%7B+%7D+%26+0.46166+%26++%26+0.53834+%26++%5C%5C++%5Ctext%7B+%7D+%26+++%5Ctext%7B+%7D+%26+%5Ctext%7B+%7D+%26+%5Ctext%7B+%7D+%26+%5Ctext%7B+%7D+%26++%5C%5C+++31+%26+++%5Ctext%7B+%7D+%26+0.26955+%26++%26+0.73045+%26++%5C%5C+++32+%26+++%5Ctext%7B+%7D+%26+0.24665+%26++%26+0.75335+%26+%5Ctext%7B+%7D+%26+%5Ctext%7B75th+Percentile%7D+%5C%5C+++++++++33+%26+++%5Ctext%7B+%7D+%26+0.22503+%26++%26+0.77497+%26++%5C%5C++%5Ctext%7B+%7D+%26+++%5Ctext%7B+%7D+%26+%5Ctext%7B+%7D+%26+%5Ctext%7B+%7D+%26+%5Ctext%7B+%7D+%26++%5C%5C+++40+%26+++%5Ctext%7B+%7D+%26+0.10877+%26++%26+0.89123+%26++%5C%5C+++41+%26+++%5Ctext%7B+%7D+%26+0.09685+%26++%26+0.90315+%26+%5Ctext%7B+%7D+%26+%5Ctext%7B90th+Percentile%7D+%5C%5C+++42+%26+++%5Ctext%7B+%7D+%26+0.08597+%26++%26+0.91403+%26++%5C%5C++%5Ctext%7B+%7D+%26+++%5Ctext%7B+%7D+%26+%5Ctext%7B+%7D+%26+%5Ctext%7B+%7D+%26+%5Ctext%7B+%7D+%26++%5C%5C+++46+%26+++%5Ctext%7B+%7D+%26+0.05175+%26++%26+0.94825+%26++%5C%5C+++47+%26+++%5Ctext%7B+%7D+%26+0.04523+%26++%26+0.95477+%26+%5Ctext%7B+%7D+%26+%5Ctext%7B95th+Percentile%7D+%5C%5C++++48+%26++%5Ctext%7B+%7D+%26+0.03940+%26++%26+0.96060+%26++%5C%5C++%5Ctext%7B+%7D+%26+++%5Ctext%7B+%7D+%26+%5Ctext%7B+%7D+%26+%5Ctext%7B+%7D+%26+%5Ctext%7B+%7D+%26++%5C%5C++++56+%26++%5Ctext%7B+%7D+%26+0.01167+%26++%26+0.98833+%26++%5C%5C++57+%26++%5Ctext%7B+%7D+%26+0.00988+%26++%26+0.99012+%26+%5Ctext%7B+%7D+%26+%5Ctext%7B99th+Percentile%7D+%5C%5C++58+%26++%5Ctext%7B+%7D+%26+0.00834+%26++%26+0.99166+%26++%5C%5C++++++%5Cend%7Barray%7D&bg=ffffff&fg=333333&s=0&c=20201002)
It is clear that in a group of 366 people, it is certain that there will be at least one repeated birthday (again ignoring leap year). This is due to the pigeon hole principle. As the percentiles in the above table shows, you do not need to survey anywhere close to 366 to get a repeat. The median is 23 as discussed. The 75th percentile of
The preceding calculation shows that you do not need a large group to have a repeated birthday. About 50% of the times, you will survey 23 or fewer people, about 75% of the time, 32 or fewer people, About 99% of the time, you will survey 57 or fewer people, much fewer than 365 or 366. So with around 50 in a random group, there is a near certainty of finding a shared birthday. In a random group of 100 people, there should be an almost absolute certainty that there is a shared birthday.
For a further demonstration, we simulated the random variable

Not shown in the table is that 33 of the simulated results are the value of 2. Thus it is possible to ask two people and they both have the same birthday. But the odds of that happening is 33 out of 10,000 according to this particular set of simulations (probability 0.0033). The theoretical probability of 2 is 1/365 = 0.002739726. There are 2 instances of 78 in the 10,000 simulated values. Thus the odds are 2 out of 10,000 with probability 0.0002. The theoretical probability is 0.000037 using (3).
___________________________________________________________________________